Guide
Use Analytics
By the end you can read every position's funnel at a glance, open one position to see where candidates drop off, and see how the ones who finished have been decided.
4 min · 6 steps · Captured from the live product 5 Oct 2026 Changelog Copy as Markdown
Before you start
- A Truffle account. The 7-day free trial works: 30 credits, no credit card.
- At least one position that has received candidates. A draft has nothing to measure.
1Open Analytics
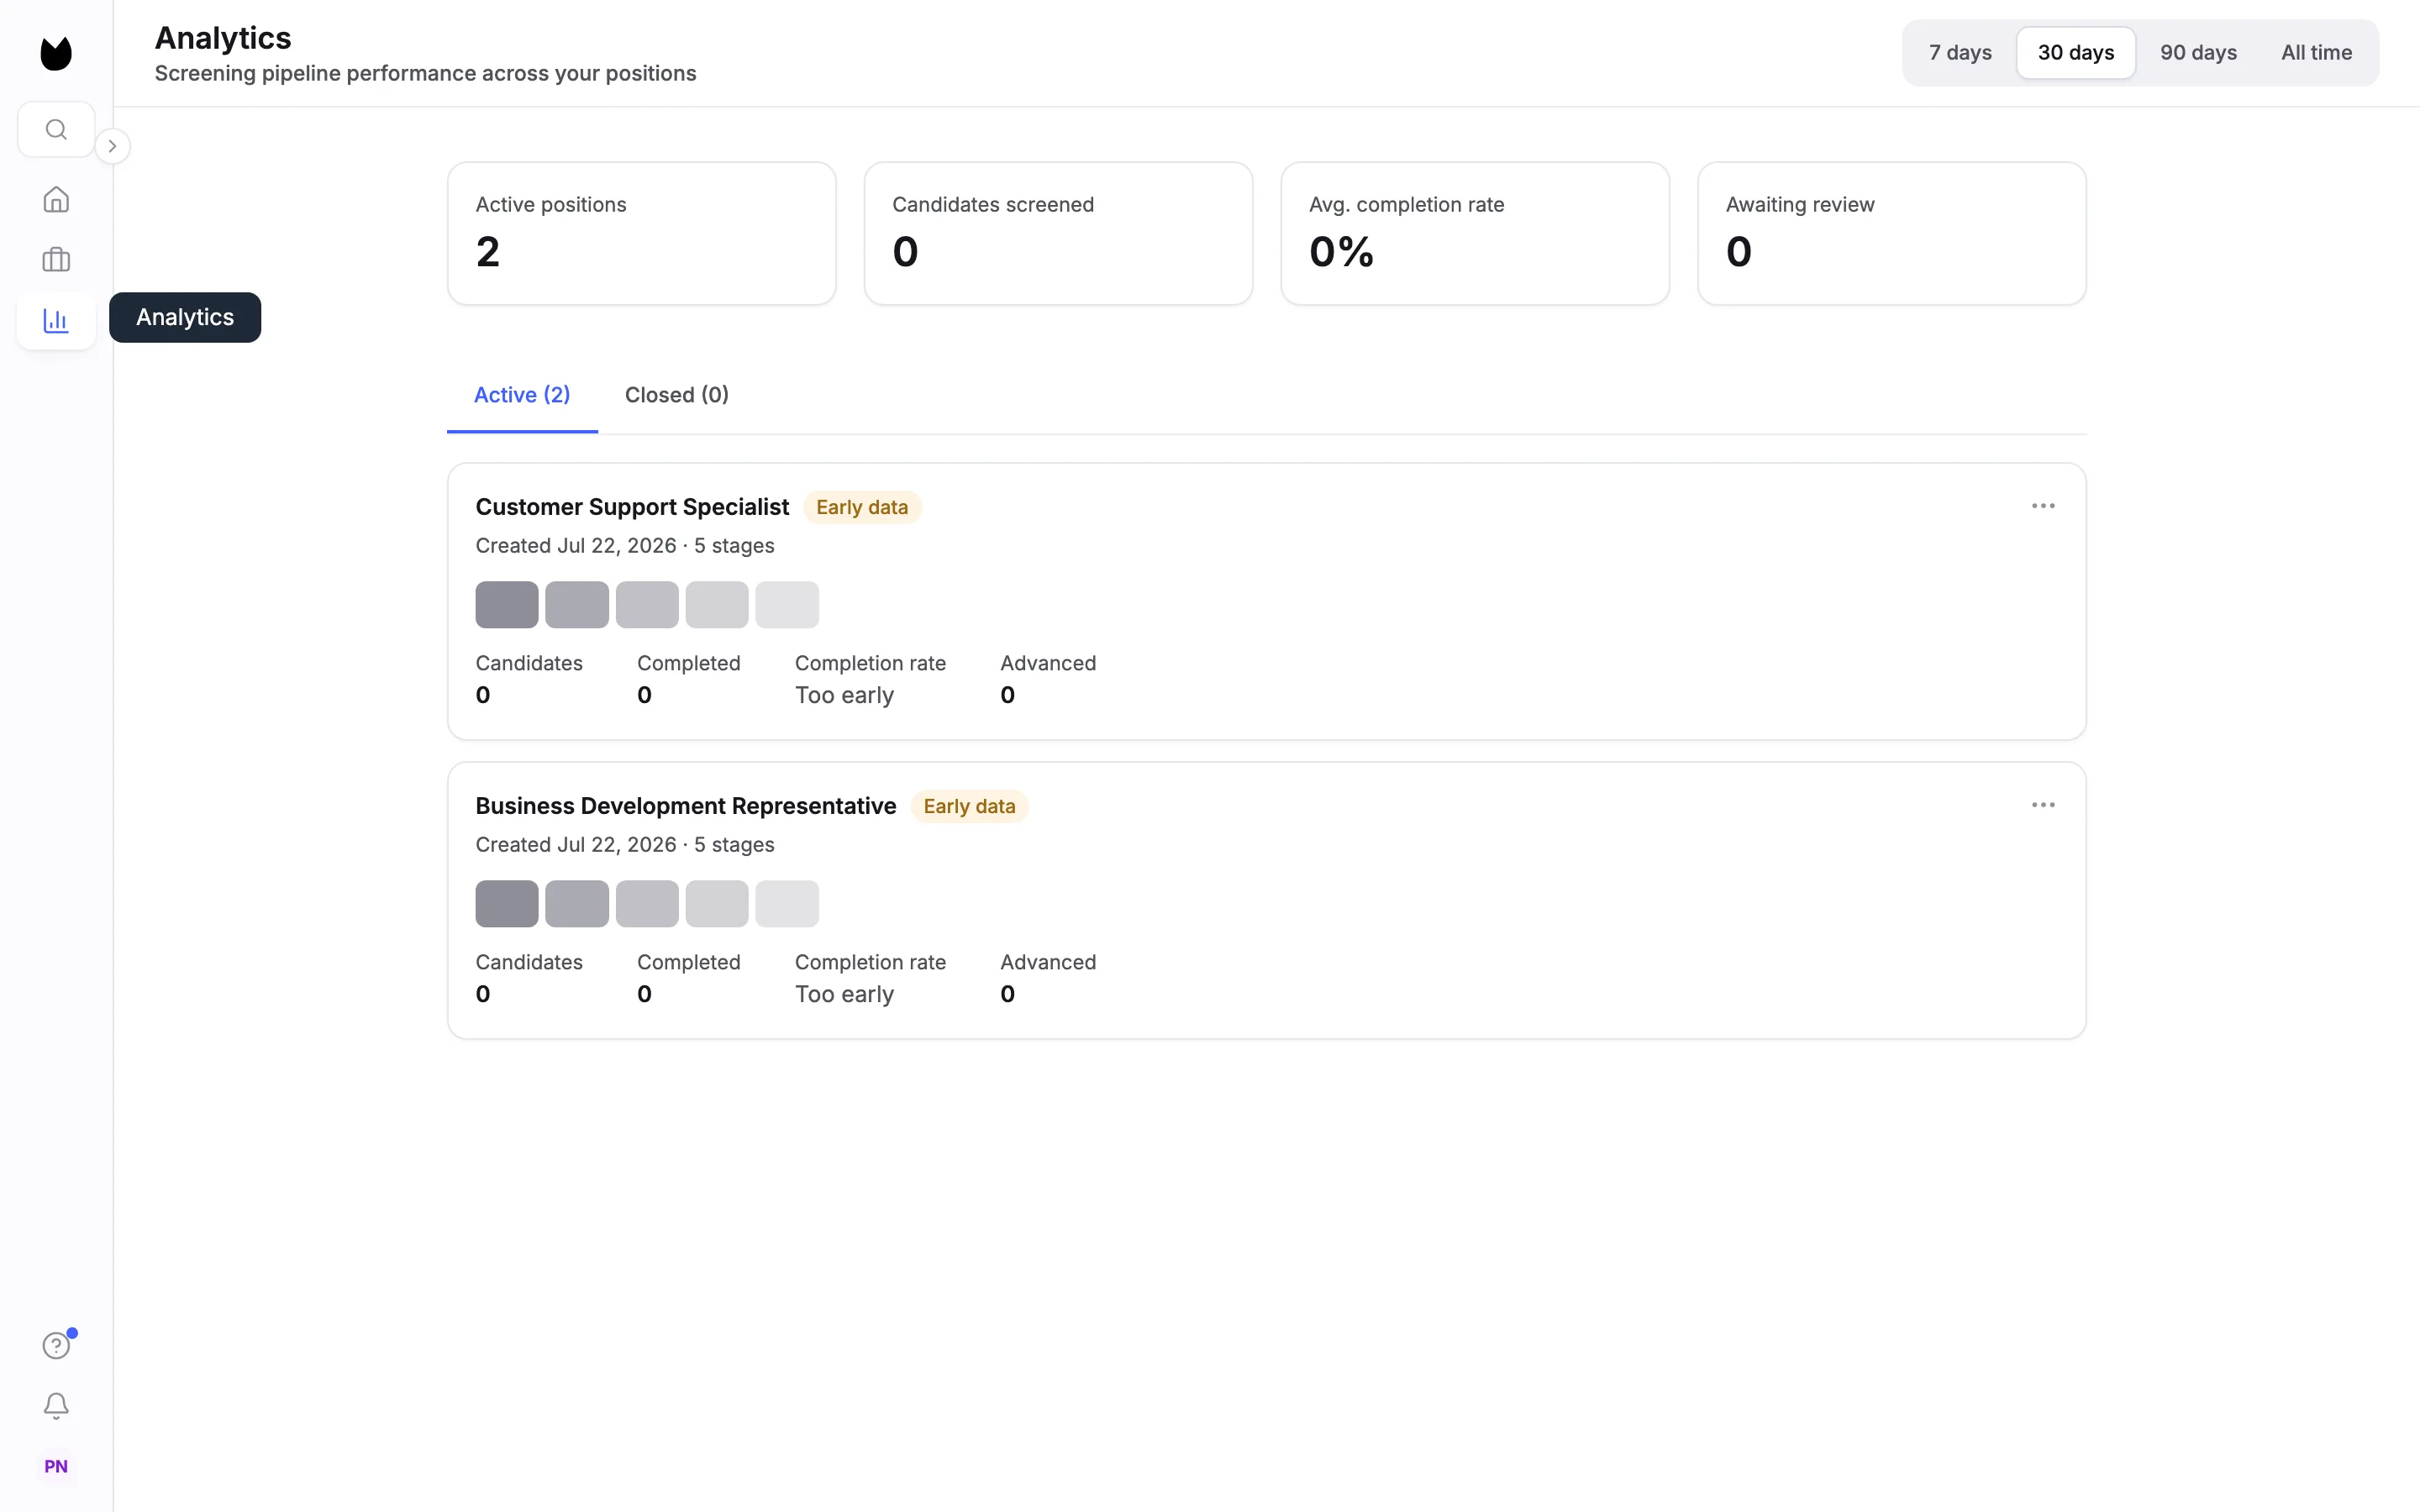
Choose Analytics in the sidebar (the chart icon). The page reads Screening pipeline performance across your positions and opens on the last 30 days. Four cards sum up your account: Active positions, Candidates screened, Avg. completion rate and Awaiting review. They count only candidates from the chosen window, so a quiet month can read zero.
2Choose a time window
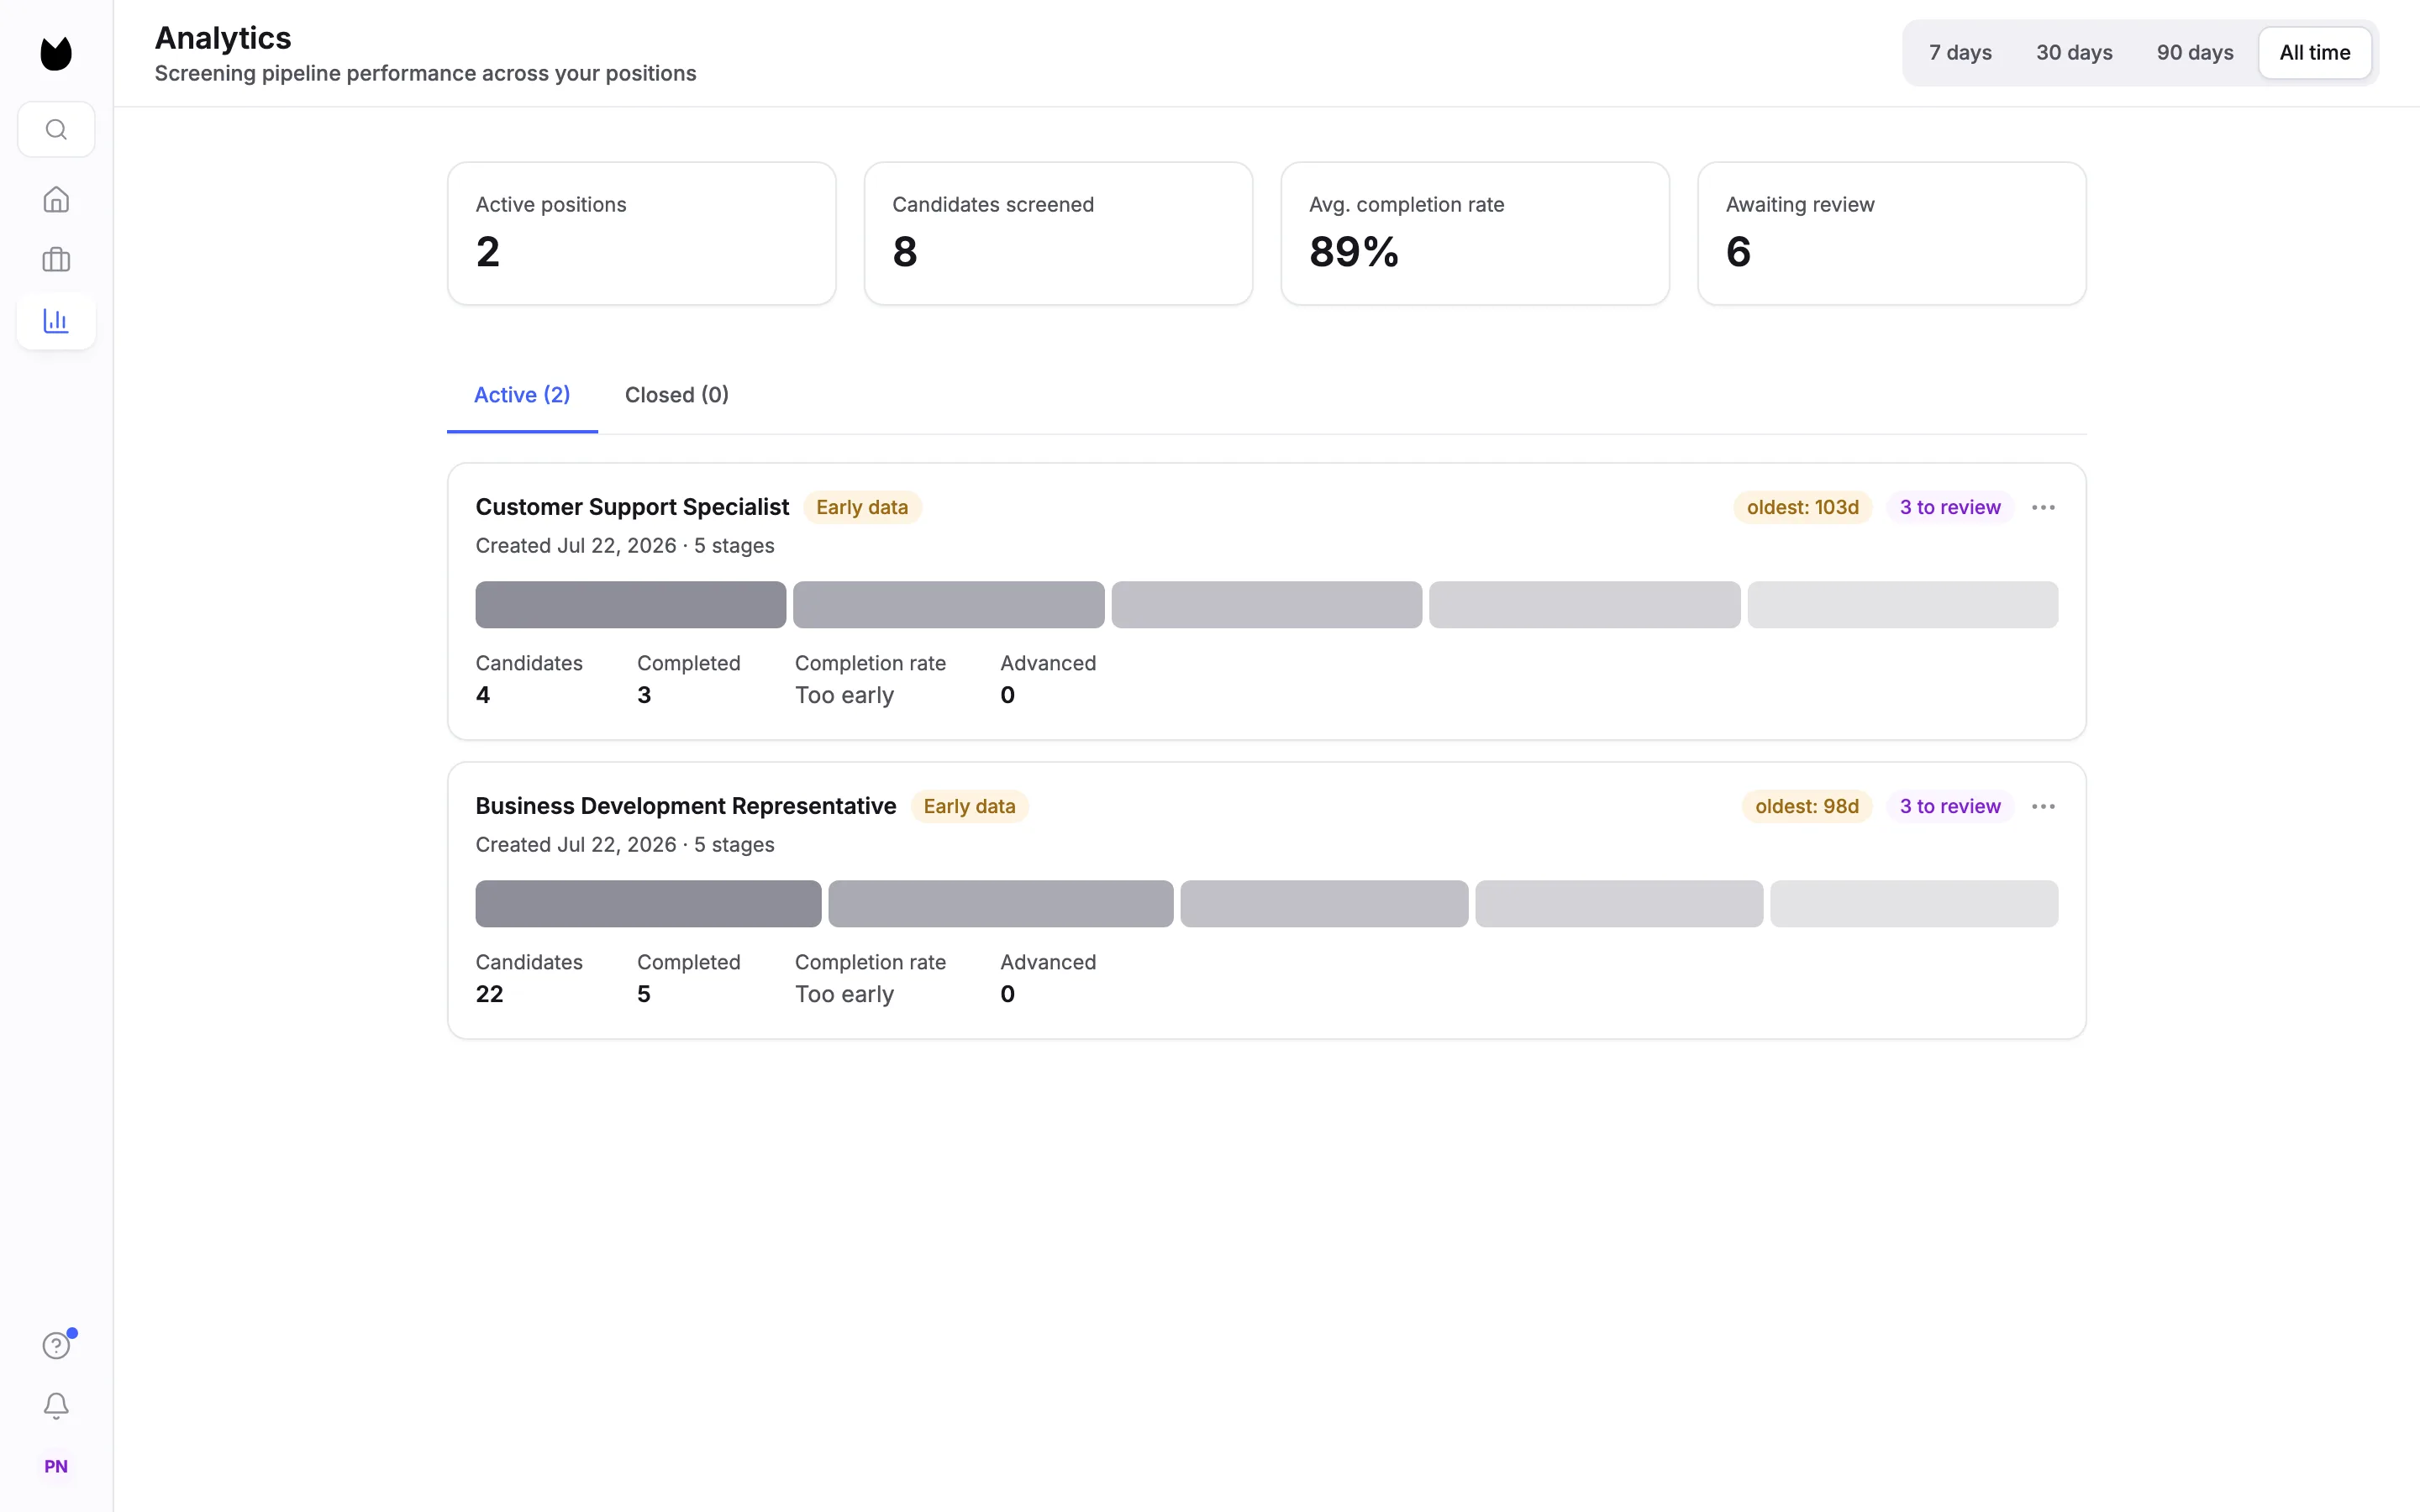
Pick 7 days, 30 days, 90 days or All time at the top right. Every number on this page changes with it. On All time, this account has 2 active positions, 8 candidates screened, an 89% average completion rate and 6 awaiting review.
3Read the position cards
Under Active (2) and Closed (0), each position has a card. Positions with candidates to review come first. A card shows the title, Early data while fewer than 10 candidates have started, how long the oldest unreviewed candidate has waited (oldest: 98d), how many are waiting (3 to review), the date it was created, a small funnel, and four numbers: Candidates, Completed, Completion rate and Advanced.
Note. With fewer than 10 started candidates, rates read Too early rather than a percentage that would swing with every new candidate.
4Open a position
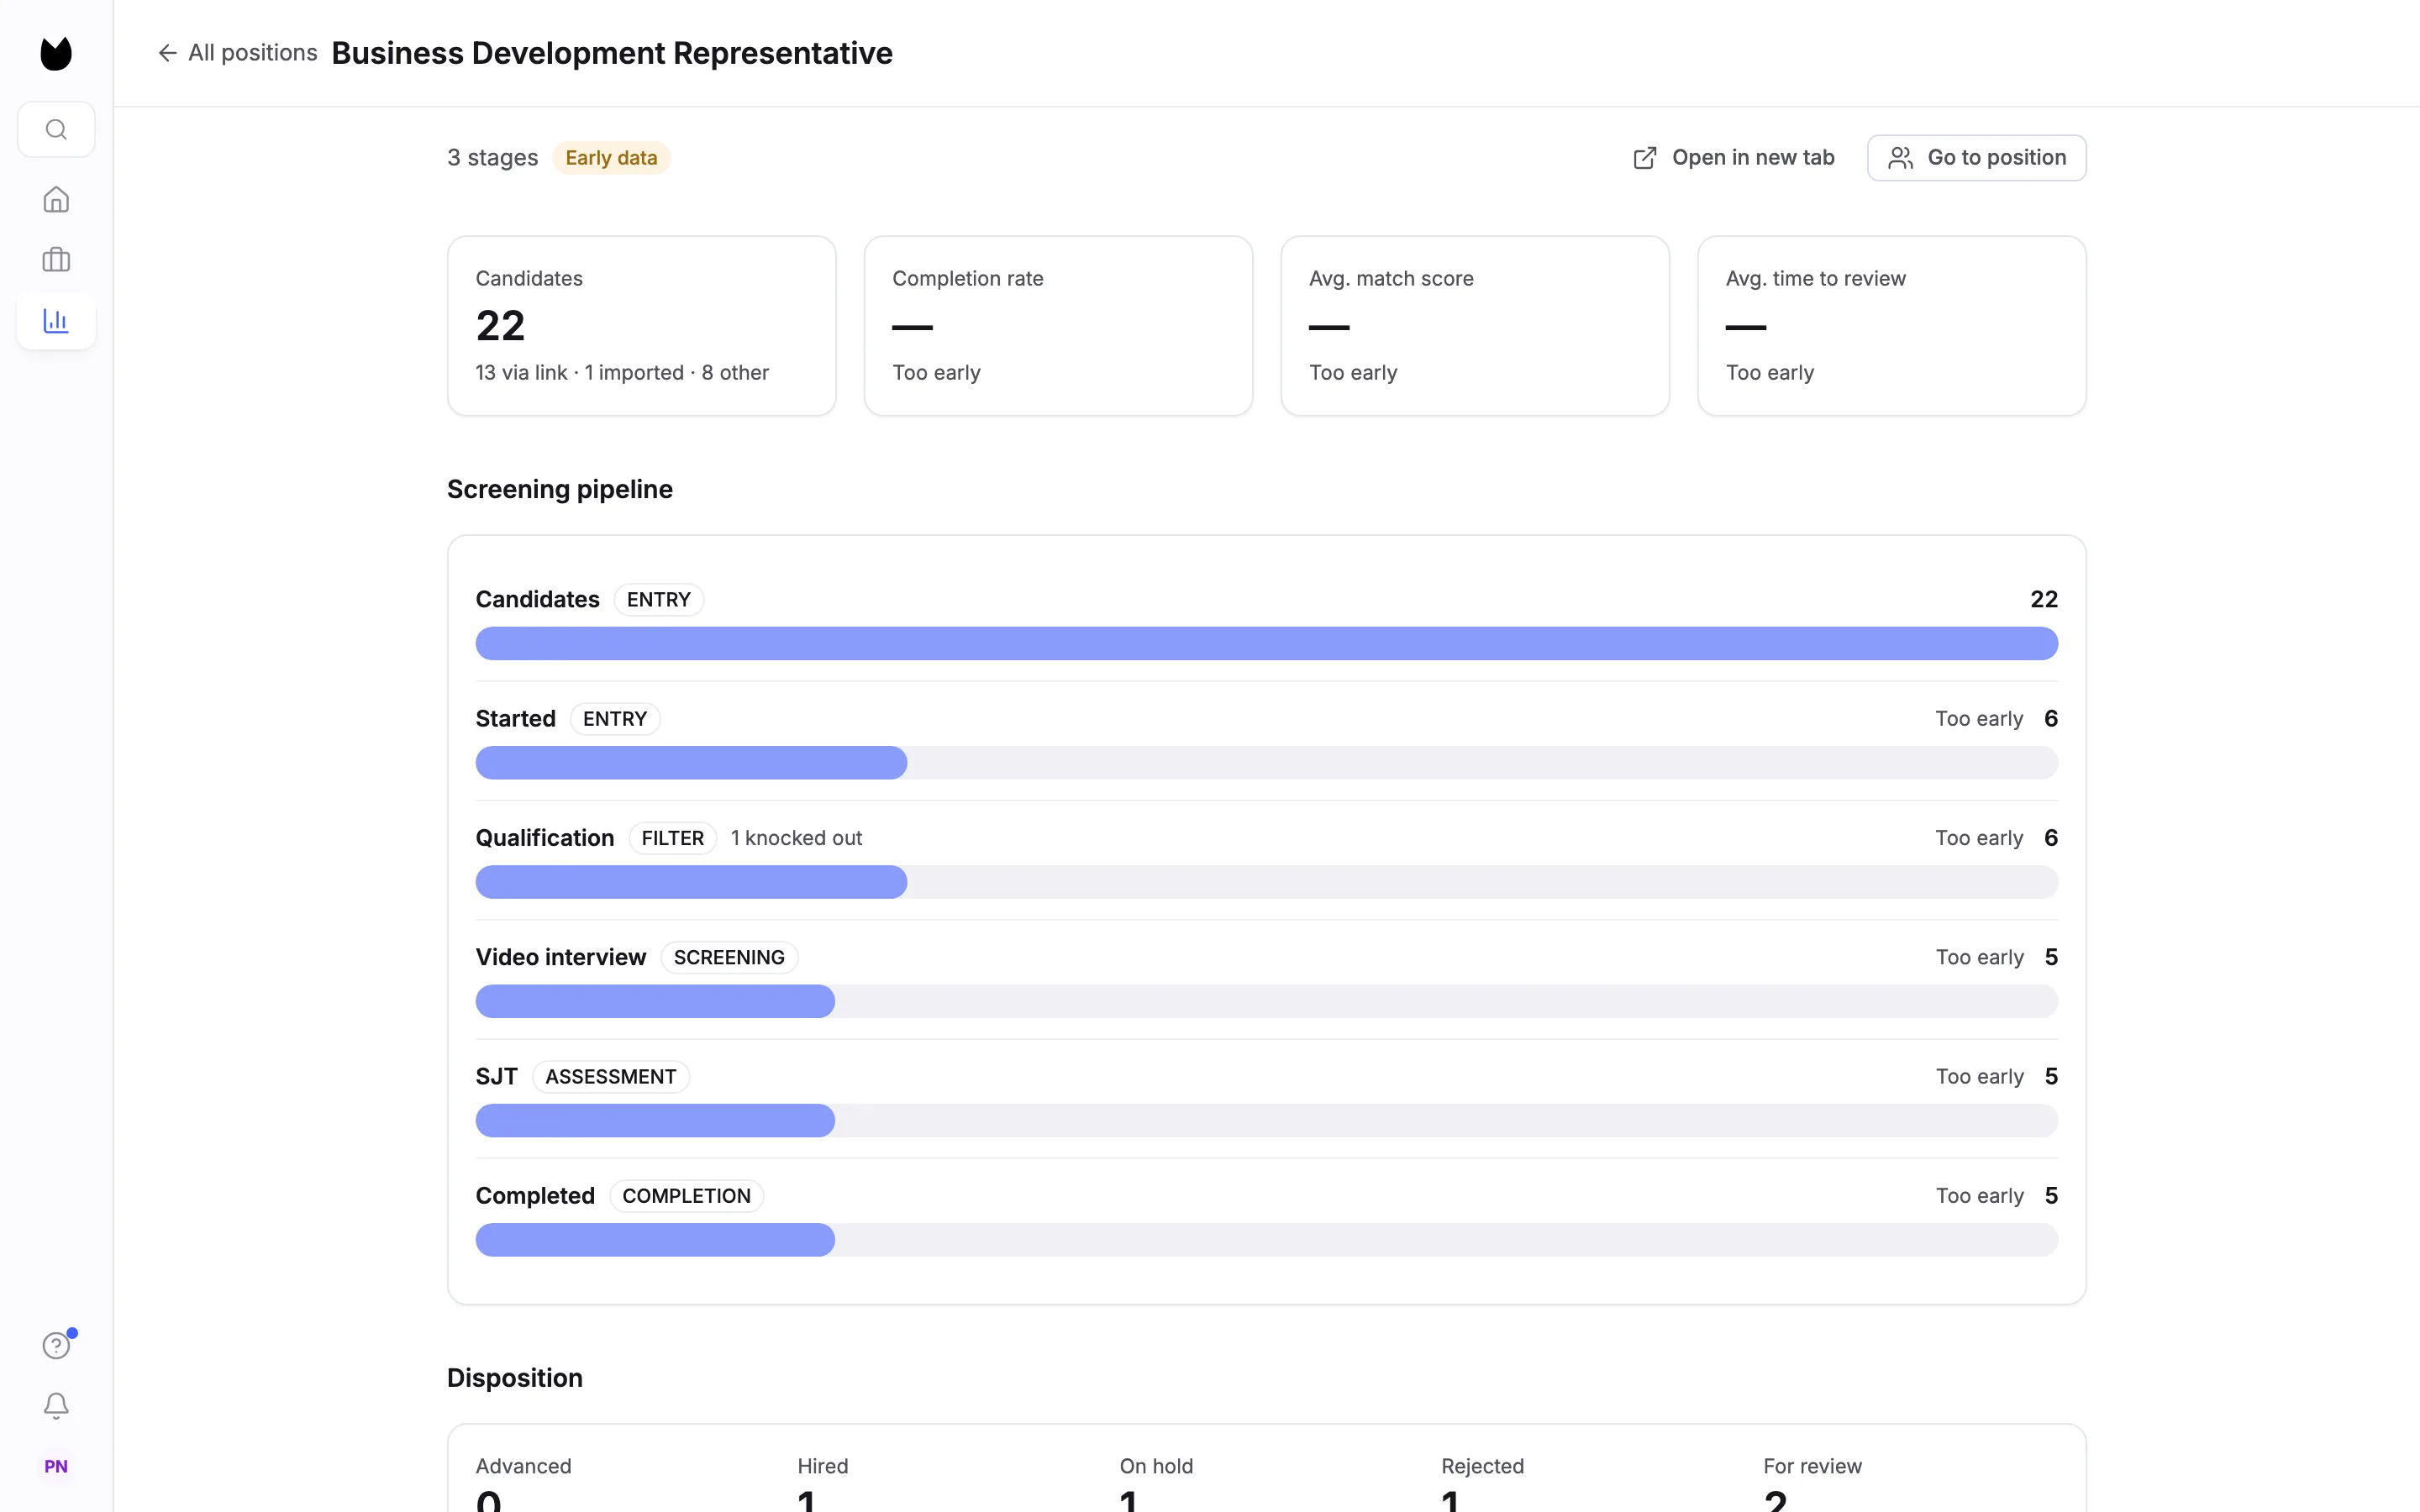
Click a card. The position's page has All positions to go back, Open in new tab and Go to position, which opens its candidate list. Four cards lead the page. Candidates gives the total and where they came from, such as 13 via link · 1 imported · 8 other. Completion rate, Avg. match score and Avg. time to review read Too early until 10 candidates have started.
5Read the funnel
Screening pipeline lists every stage in order, each labelled with its role in the funnel and its count. Here: Candidates 22 and Started 6 (ENTRY), Qualification 6 (FILTER, with 1 knocked out), Video interview 5 (SCREENING), SJT 5 (ASSESSMENT) and Completed 5 (COMPLETION). Once 10 candidates have started, each stage also shows the percentage that came through from the stage before. Until then it reads Too early.
6See how finished candidates were decided
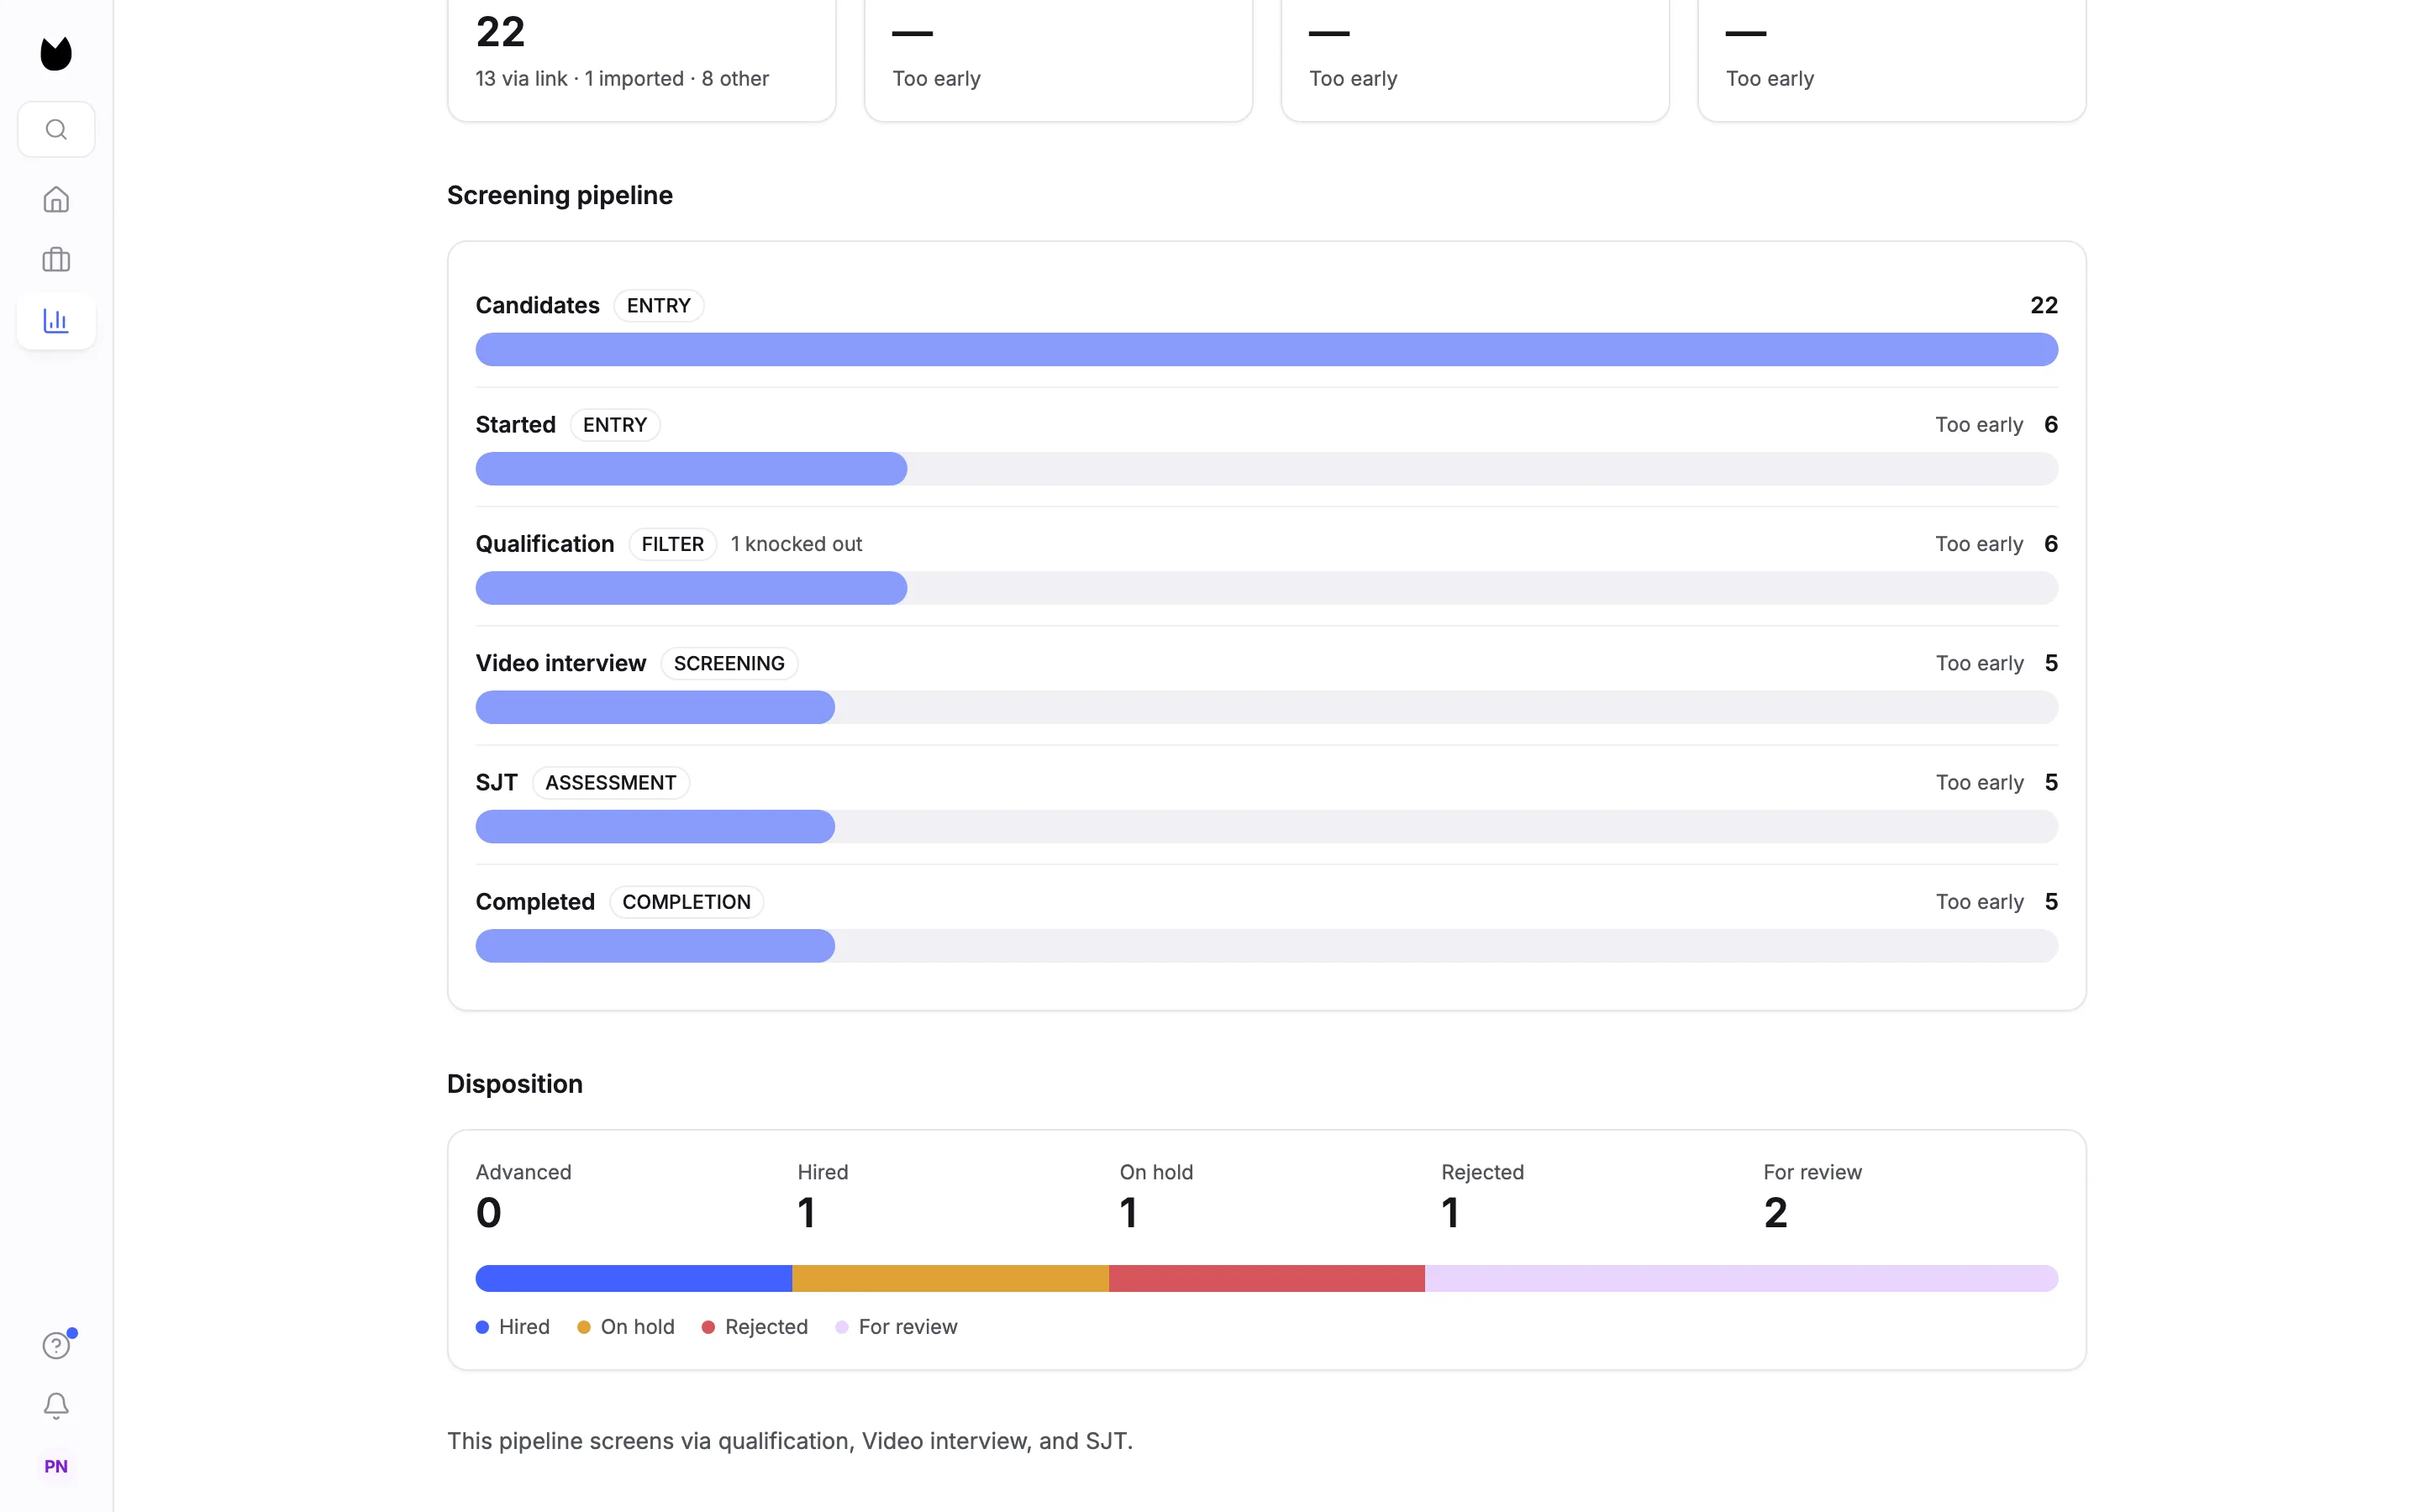
Disposition splits the candidates who completed screening by status: Advanced, Hired, On hold, Rejected and For review. Here the 5 who completed are 1 hired, 1 on hold, 1 rejected and 2 still for review. A line at the bottom names the stages this position screens with.
Note. A hired candidate counts once, in Completed and under Hired. Every status here was set by a person: Truffle's scores never advance, hold or reject anyone.
Questions
Why does Analytics say Too early?
Rates and the conversion between stages appear once at least 10 candidates have started on a position. Below that, the position is marked Early data and rates read Too early. Counts are always shown.
Why do the overview cards show zero?
The overview opens on the last 30 days and counts only candidates from that window. Choose 90 days or All time to include older candidates.
What counts as Completed?
A candidate who finished every stage of the screening. Hired candidates stay in Completed and are also counted under Hired in Disposition, never twice in the funnel.
Can I see closed positions?
Yes. The Closed tab on the Analytics overview lists them, with the same cards as active positions.
Does Analytics include drafts?
No. A draft position has not collected candidates, so it has nothing to measure.
Related
See something here that doesn't match what you see in Truffle? Tell us and we'll fix the page.