How to build a salary benchmarking tool with Claude
Most small teams rent salary data because building the tool felt out of reach. That stopped being true. Here's the exact afternoon-long build, prompt by prompt, and the one step that decides whether you end up with a tool or a toy.


AI summary
- Salary benchmarking tools used to be something you rented, because building one meant engineering time a small team doesn't have. With Claude, you describe the tool in plain English and have a working version in an afternoon, for free.
- The build is the easy part now. Start with one prompt that states the job to be done, then refine: add levels, locations, company stage, a percentile range, and a total comp breakdown. The exact prompts are below.
- The numbers Claude generates are placeholders, not market truth, and that's more than caution talking. One tested comparison found Claude's compensation estimates missed real market data by more than 15% most of the time, and underestimated senior roles by 50 to 80%. The step that turns a toy into a tool is replacing the placeholders with data you trust, like your own offer history. AI builds the interface. You own the data and the decision.
Last month I needed a salary range for a software engineer hire in Austin. Not a ballpark. A defensible number I could put in a job post and hold my ground on when the hiring manager pushed back.
My options were all bad, and none of them fit a company with no comp team and no HR headcount to spare for this. Pay thousands of dollars a year for a comp data subscription I couldn’t justify for a team our size. Dig through a market report from last September and hope the market hadn’t moved. Or do what I actually did: open a dozen tabs, cross-check Levels.fyi against a LinkedIn range against two numbers a recruiter friend texted me, and average them into a guess.
That guess took 40 minutes, and I didn’t trust it.
The frustrating part isn’t that good comp data doesn’t exist. It’s that it lives in someone else’s tool, shaped around someone else’s questions, priced for someone else’s budget. The number I needed, for this role at this level in this city at our stage, was never one click away. It was fifteen.
The data was never the hard part
For years the answer to this was simple. The data is the product, so you rent the data. You pay for the dataset and the tool around it comes along for the ride.
But the data was never the expensive part for a team like mine. Plenty of decent market data is public or already sitting in our own offer history. What I was really paying for was the interface and the upkeep. The thing that turns a column of numbers into an answer.
That part got cheap. I rebuilt the interface myself, in an afternoon, with Claude. It cost nothing, and it answers my questions instead of someone else’s. The data I still own. That distinction turns out to be the whole game, and I’ll come back to it.
Here’s where it landed. One page where I pick a role, level, location, and company stage, and get a median base, the full percentile range, a total comp breakdown, and a table of comparable roles to sanity-check against.
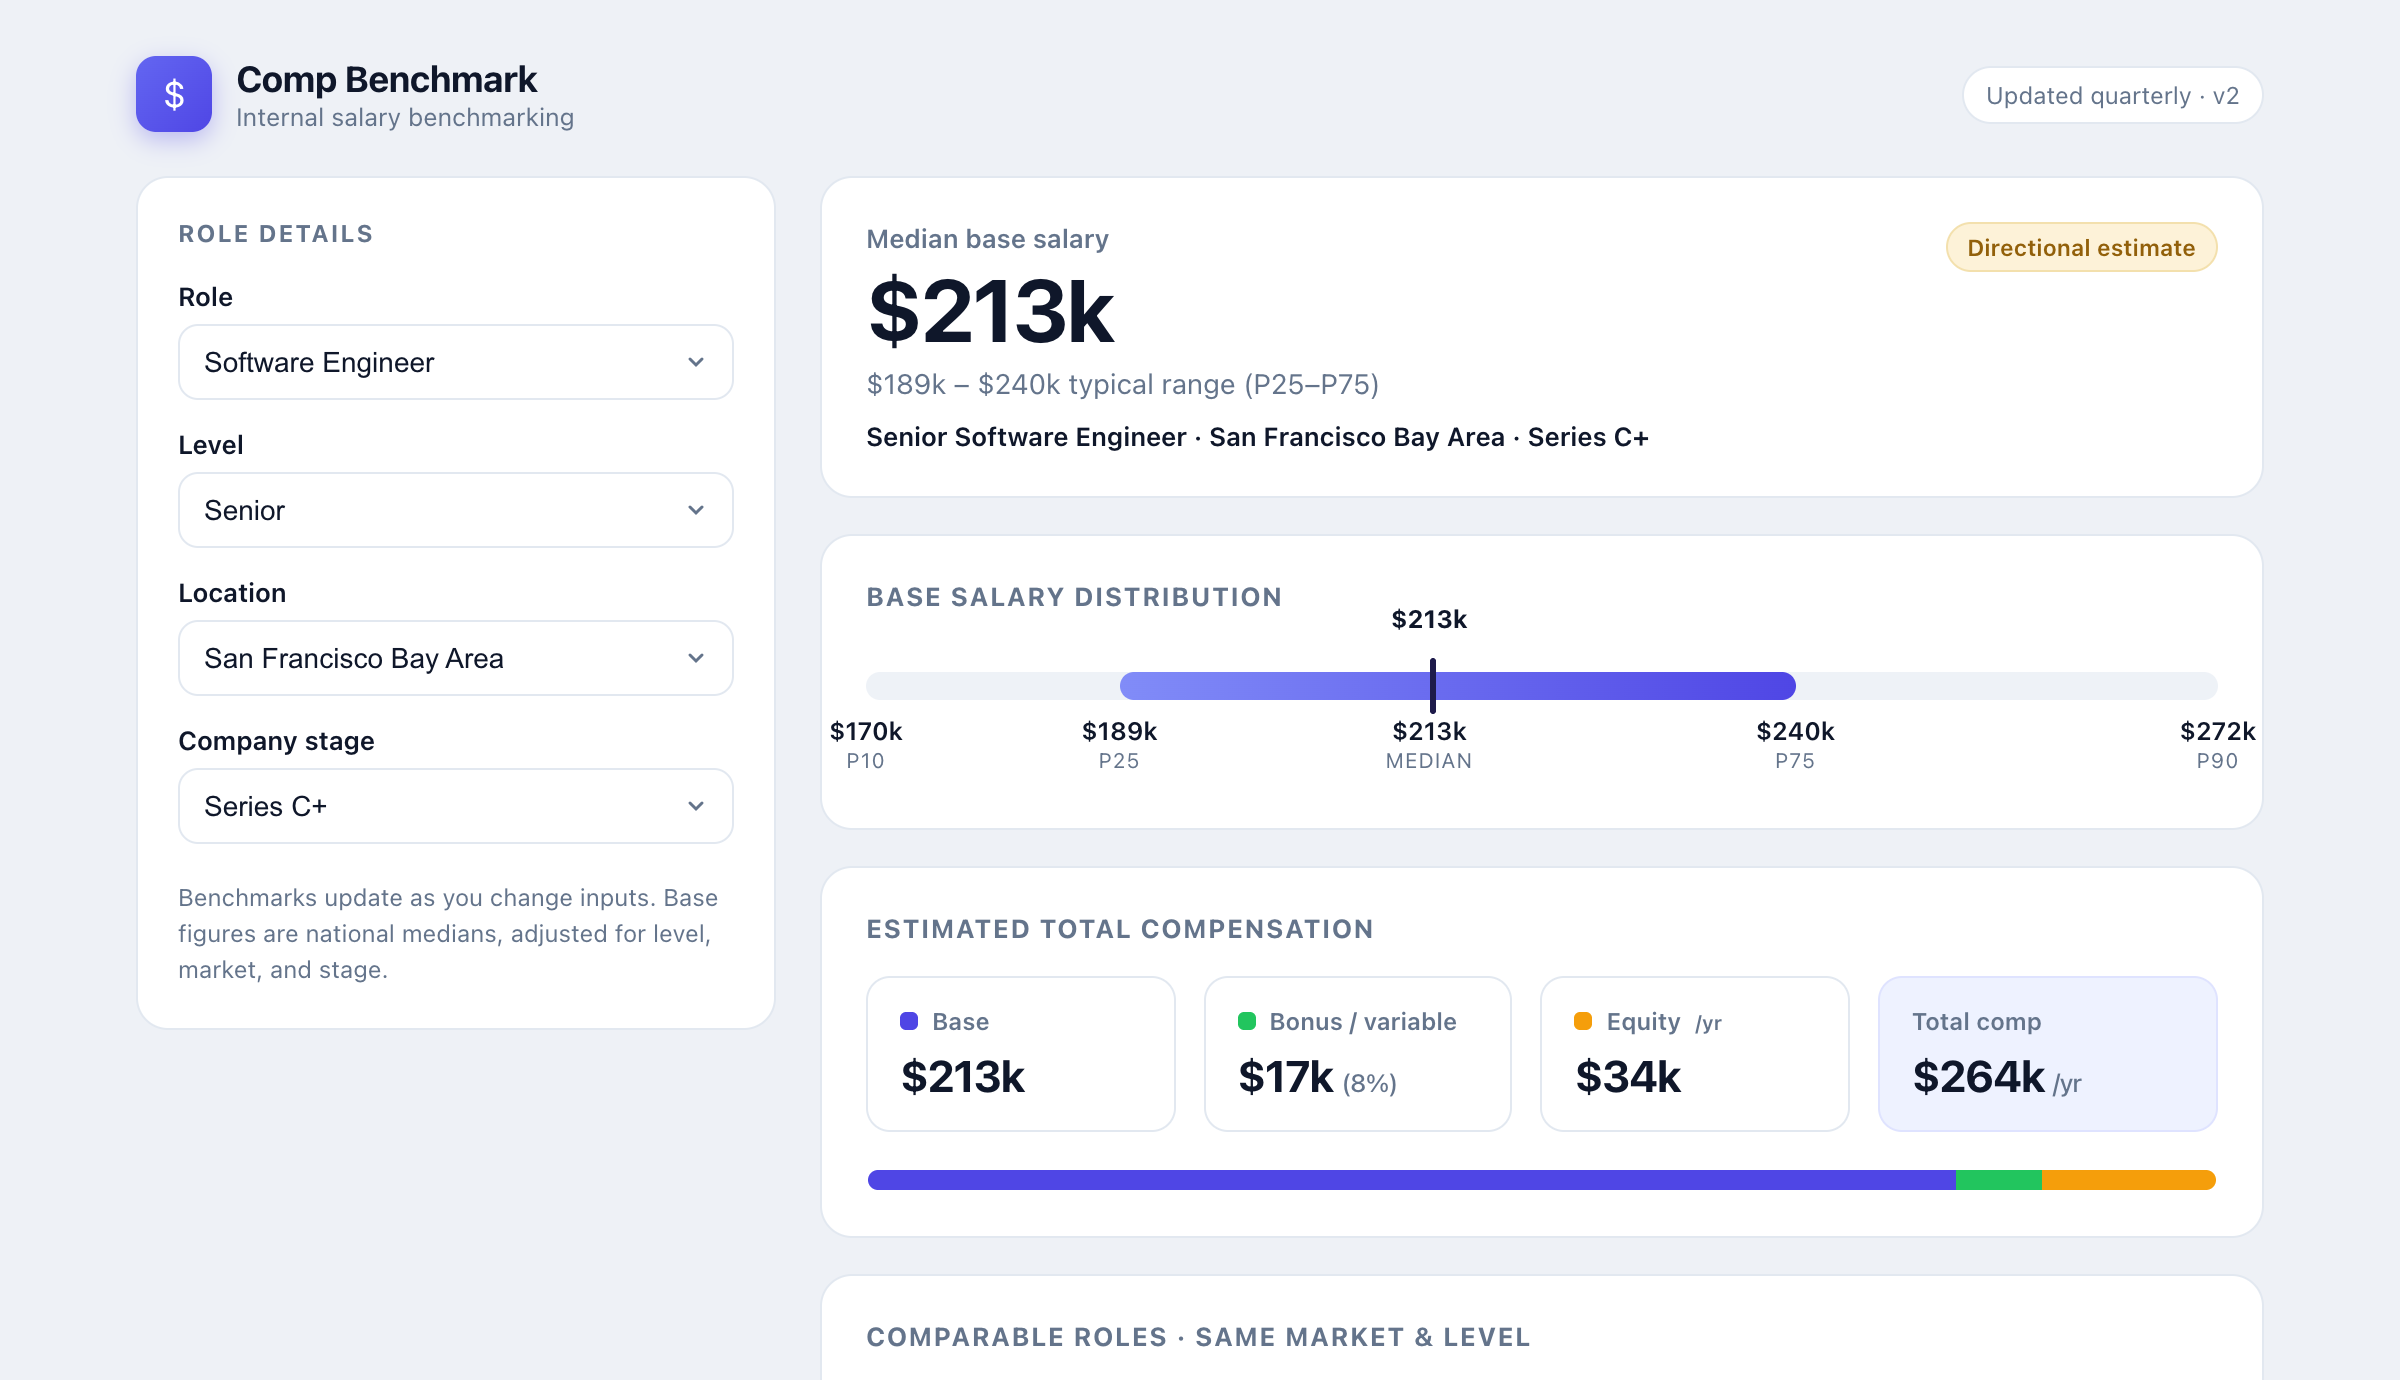
I’m going to walk through the exact build, prompt by prompt, because the prompts are the interesting part. Copy them and swap in whatever your team actually hires for, whether that’s an engineer with an equity component or an hourly coordinator role with none.
The first prompt gets you something rough and working
I opened Claude, described the job I needed done, and let it write the code. Claude builds this kind of thing as an artifact, an interactive panel that runs right there next to the chat, so you see the working tool the moment it finishes.
Here’s the opening prompt:
I run people ops at a 40-person company with no comp team and no
budget for a subscription tool. I want a simple internal salary
benchmarking tool I can use in the browser. Let me pick a role, a
level (entry / mid / senior), and a location, and show me an
estimated median base salary plus a typical range. Build it as a
single self-contained HTML file with the data baked in, so I can run
it without a server. Use believable US market numbers as placeholders
for now.
Thirty seconds later, this:
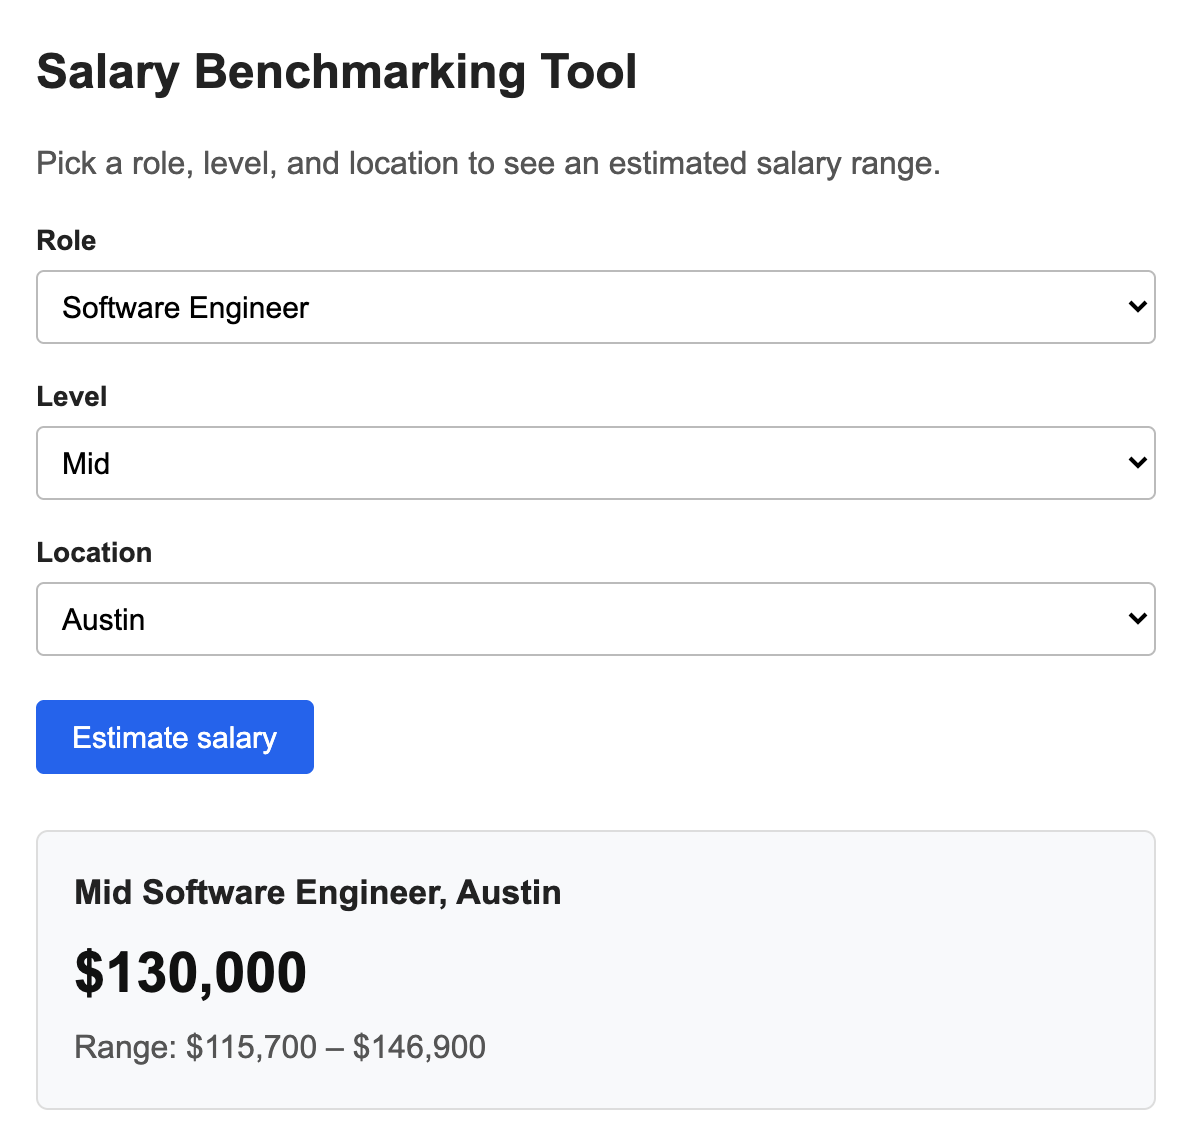
It’s plain. The numbers are placeholders Claude generated. But it works. Pick a role, get a range, and the math stays consistent as you change the inputs. That’s the right place to start.
Notice what the prompt did and didn’t ask for. I described the job to be done, not the design. I didn’t say “make it look good” or specify a single color. Design is easy to bolt on once the logic is right, and asking for it too early just gives you a pretty thing that calculates the wrong numbers.
Refine the model until it answers real questions
A single median is almost useless on its own. Nobody gets hired at exactly the median, and base salary is only part of what you’re offering. So the next prompt pushed the model closer to how comp actually works:
Good start. Now make it more useful:
- Add a company stage input (seed, Series A-B, Series C+, public).
- Show the full distribution: P10, P25, median, P75, P90, as a
	labeled range bar.
- Break out estimated total comp: base, bonus or variable, and
	annualized equity, with a stacked bar.
- Recalculate live whenever I change any input. Keep it one file.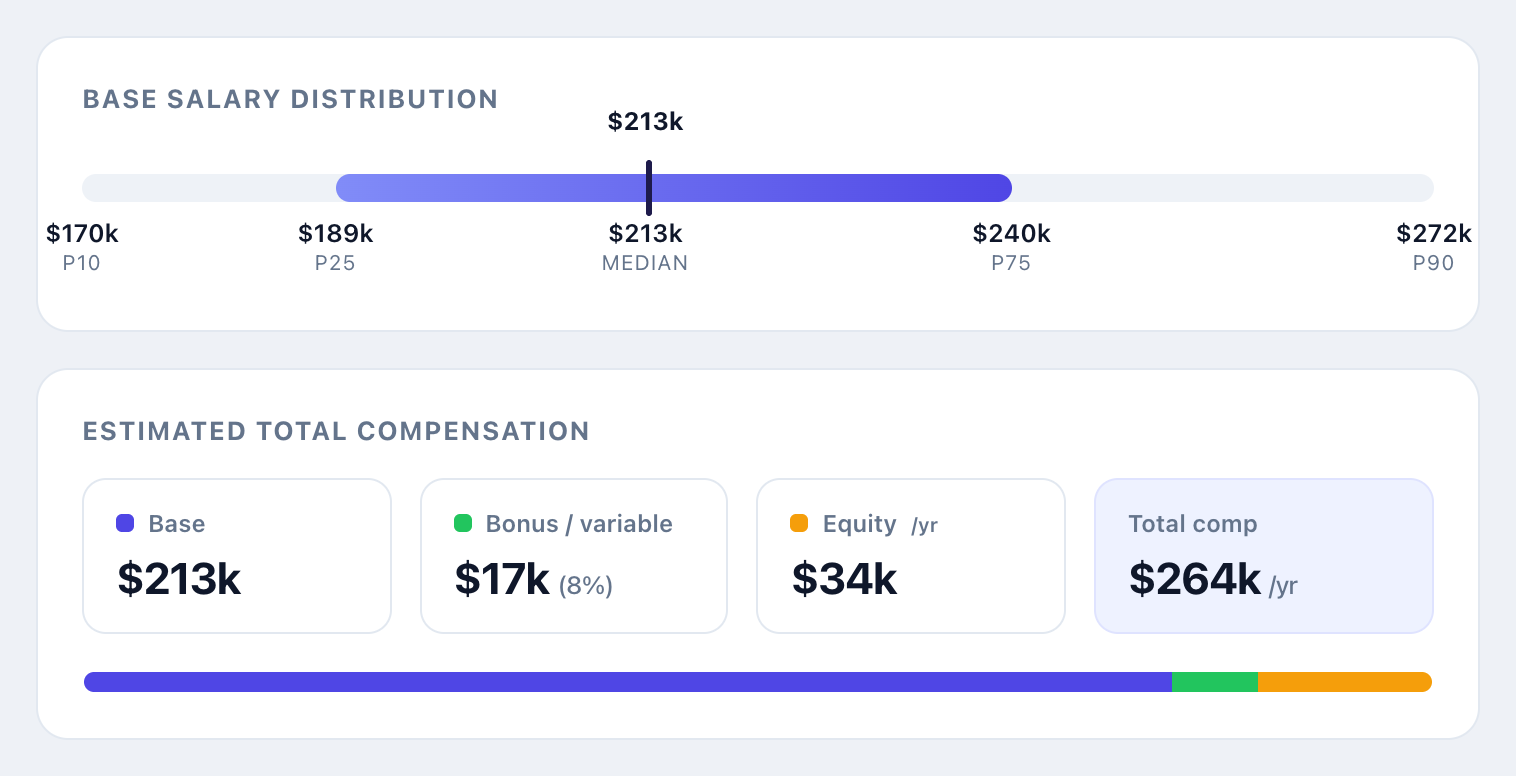
This is the version I’d actually use. The range bar matters more than the single number, because the gap between P25 and P75 is the real conversation with a candidate and a hiring manager. And splitting base from bonus and equity is the difference between a number and an offer. For an early-stage role, equity can do half the work, which never shows up if all you quote is base. That blind spot is exactly the total compensation gap that makes offers fall apart at the last step.
Switch to a senior software engineer in the Bay Area at a Series C company and the tool now shows a $213k median, a $189k to $240k typical range, and roughly $264k in total comp once you add variable pay and annualized equity. Same logic, different inputs, instant answer. That’s the thing I could never get from fifteen browser tabs. Swap in whatever you actually hire for, whether that’s a senior engineer’s equity-heavy package at a funded startup or an hourly office coordinator role at a five-person shop, and the same lookup-and-multiply logic holds. Only the table underneath it changes.
The data is the part you can’t outsource
Here’s the prompt that matters most, and it has two halves.
Two changes. First, add a "comparable roles" table showing every role
at the same level and market, so I can sanity-check relative pay.
Second, and put this where I can't miss it: add a clear note that
these are directional placeholder numbers, not a source of truth, and
that I should replace them with our own offer data before making any
real offer.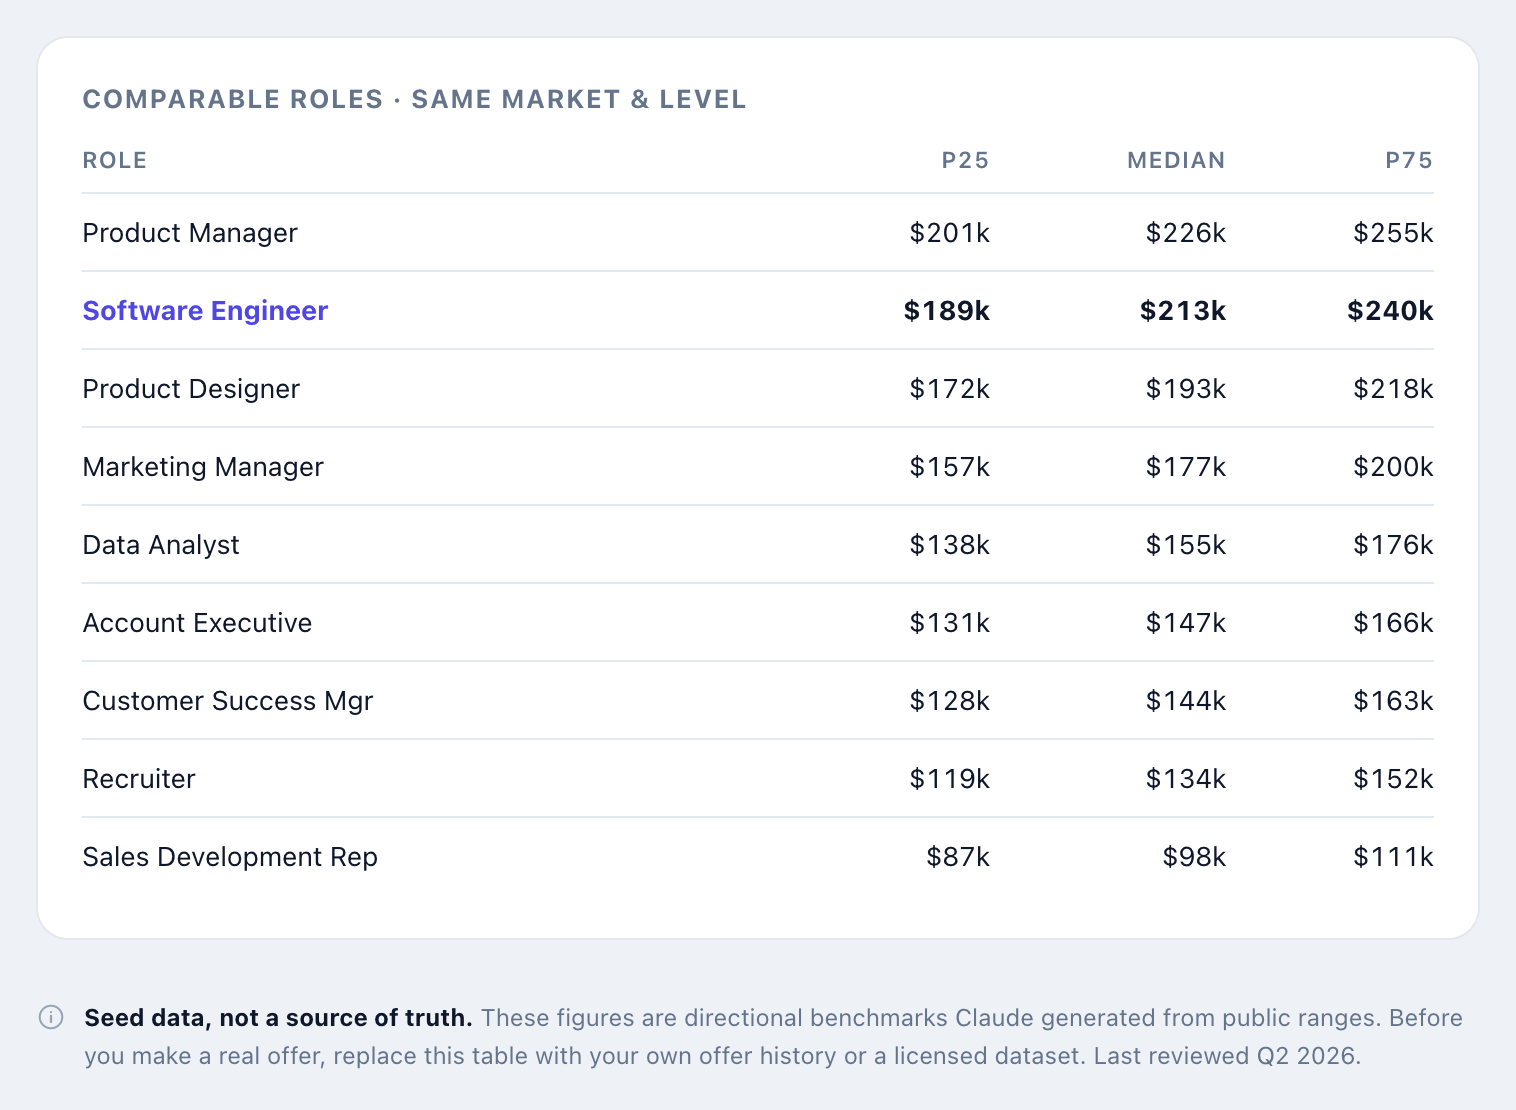
I told Claude to write that warning into the tool on purpose. The placeholder numbers look authoritative the second they sit in a clean interface with percentile bars next to them. They aren’t. They’re a model’s best guess from public ranges, and a confident wrong number is more dangerous than an obvious blank, because you stop questioning it.
That’s not hypothetical caution. AIHR tested Claude’s compensation outputs against real market data across a set of tech roles, benchmarking against Glassdoor, the Bureau of Labor Statistics, Robert Half, and Levels.fyi. Only 16% of Claude’s estimates landed within 5% of the benchmark. 61% missed by more than 15%. At senior individual-contributor levels, Claude underestimated pay by 50 to 80%, because it leans on public salary sources that flatten the real gap between junior and senior compensation. The higher the level you’re pricing, the less you should trust the number it hands you on its own.
So the real step, the one that turns a toy into a tool, is the second half of the prompt:
Here's our actual data. I'm pasting our last 18 months of offers as a
CSV (role, level, location, base, bonus, equity). Replace the
placeholder dataset with this and recompute every median and
percentile from our real numbers.
Now the tool isn’t telling me what the internet thinks a role pays. It’s telling me what we have actually paid, structured so I can extend it to roles we haven’t hired for yet. If you don’t have enough offer history, a licensed compensation dataset works the same way. So do the published ranges that pay-transparency laws now put on most job posts in your market. The point is the same either way: the source has to be something you’d defend in a calibration meeting, not something a model invented. This is the unglamorous half of any data-driven recruitment effort, and it’s where most of them quietly fall down.
The part that actually runs the whole thing
You don’t need to read code to build this. But it helps to see the engine, because it’s smaller than you’d think. Everything Claude wrote comes down to a few lookup tables and one line of math:
const ROLES = {
	"Software Engineer":   { base: 130000, bonus: 0.08, equity: 0.16 },
	"Product Manager":     { base: 138000, bonus: 0.12, equity: 0.15 },
	"Recruiter":           { base: 82000,  bonus: 0.09, equity: 0.06 },
	"Office Coordinator":  { base: 48000,  bonus: 0.03, equity: 0.0  },
	"Customer Service Rep": { base: 42000, bonus: 0.03, equity: 0.0  },
	// ...one line per role
};
const LEVELS    = { Entry: 0.78, Mid: 1.0, Senior: 1.32, "Staff / Lead": 1.62 };
const LOCATIONS = { "San Francisco Bay Area": 1.24, "New York City": 1.16, Austin: 1.0, "Remote (US)": 0.96 };
const STAGES    = { Seed: 0.92, "Series A-B": 0.97, "Series C+": 1.0, "Public / Enterprise": 1.06 };
// Median base = a role's national median, adjusted for level, market, and stage.
function medianBase(role, level, location, stage) {
	return ROLES[role].base * LEVELS[level] * LOCATIONS[location] * STAGES[stage];
}
That’s the whole idea. A base number per role, then multipliers for level, market, and stage. The percentile bars, the stacked chart, the table, and the styling are all presentation that Claude handles. The model is the part that’s yours to argue with, and it’s readable enough that you can. If you think Austin shouldn’t sit at the national baseline, you change one number. Try doing that inside a subscription tool.
Shipping it took one more prompt
This is what I want. Give me the final file so I can host it, and tell
me the two-line change I'd make each quarter to refresh the numbers.
Claude handed back the file and the instructions. I dropped it on an internal page behind our SSO, though you could just as easily keep it as a published artifact with a private link, or paste it into a Notion embed. Refreshing it every quarter means swapping the dataset and nothing else. The interface I built once. The numbers I update in two minutes.
What this is and what it isn’t
This tool helps me think. It does not make the call.
The scaffolding numbers are not offers. Even with our real data loaded, the output is a starting point for a conversation, not a verdict. Comp is judgment plus a real legal surface, from pay-transparency rules to pay-equity reviews, and none of that is something you want a lookup table deciding for you. The right way to use the range is to bring it into the process early, the way you’d put pay range alignment in the first screening call so you don’t fall in love with a candidate who’s $30k out of band. When it’s time to actually write the thing, your offer letter still has to reflect the specific person, not the median of a category.
Get the number wrong in the job post itself, and you feel it before you ever open a resume. Price a role below what the market actually pays and strong candidates skip it without a word. Post a range built off an unchecked Claude guess that runs high, and you spend the next two weeks reading through people who were never going to accept what you can actually offer once you get there. A range you can defend isn’t just a comp exercise. It’s the first filter on how many wrong-fit resumes land in your inbox in the first place.
In other words, the AI built the interface and does the arithmetic. The data and the decision stay with me. That’s not a limitation I’m working around. It’s the line I want to keep.
The build-versus-buy line moved
The reason this matters goes past comp.
For a long time, a small team’s answer to almost any workflow gap was to buy a tool, because the build option meant engineering time we didn’t have. Claude changed that math for a specific class of problem: contained, logic-shaped tools where you already know the rules and just need an interface wrapped around them. A salary benchmarker is one. So is a PTO accrual checker, a leveling rubric, an interview-debrief scorer. Things you used to rent, you can now build before lunch.
What didn’t change is the other class of problem, where the hard part isn’t the interface, it’s judgment at scale. Screening is the clearest example. A good salary range gets you more applicants, which means more resumes to read and more people to talk to, against the same number of hours in your week. You can’t prompt your way out of reviewing 300 candidates by Friday.
That’s a different kind of tool. Truffle is an AI screening platform that combines resume screening, one-way video interviews, and talent assessments, so you design the screening process that fits the role instead of bolting separate tools together. The benchmarking tool tells you what to pay. Candidate screening software like Truffle handles what shows up after you post the role at that number: AI transcribes and scores each response against the criteria you set, then surfaces a ranked shortlist with Candidate Shorts, 30-second highlights of what stood out in each response, so you spend your time on the few conversations worth having. The arithmetic of a comp range is a job for an afternoon project. Reading a flooded funnel without losing your week is a different problem, and you stay in control of the call either way.
So the question I keep coming back to in 2026 isn’t “what should we buy.” It’s two questions. What can I build now that I couldn’t last year. And what should I still trust a person to decide. The salary tool sits firmly in the first bucket. Who gets the offer sits firmly in the second. Most of the job is knowing which is which. If Claude turned this into an afternoon project, it’s worth seeing what else it can take off your plate as a recruiter or ops lead.
Frequently asked questions about building a salary benchmarking tool with Claude
Can you build a salary benchmarking tool with Claude?
Yes. You describe the tool in plain English and Claude writes the code. A working version that takes a role, level, and location and returns a median base salary plus a typical range takes one prompt. A few follow-up prompts add company stage, total compensation, and comparable roles. You don’t need to know how to code, though it helps to know which questions you want the tool to answer.
Is AI-generated salary data accurate enough to set pay?
No. The numbers Claude generates are directional estimates from public ranges, not a source of truth, and you should not make real offers off them. Use them as a scaffold, then replace the placeholder dataset with data you trust, like your own offer history or a licensed compensation dataset. The tool’s value is the interface and the math, not the starter numbers.
Do you need to know how to code to build a tool with Claude?
No. You describe what you want in plain language and Claude writes a self-contained file you can open in a browser. Knowing a little about how the data is structured helps you refine it, but you can build and adjust the whole thing through conversation.
How do you keep the salary benchmarks up to date?
Refreshing the tool means swapping the dataset, not rebuilding the tool. Once your own offer data or a licensed dataset is the source, you paste an updated export each quarter and have Claude recompute the medians and percentiles. The interface stays the same.
How accurate is Claude at estimating salary compared to real market data?
Not accurate enough to set pay on its own. AIHR compared Claude’s compensation outputs to real market benchmarks and found only 16% of estimates landed within 5% of the real figure, 61% missed by more than 15%, and senior individual-contributor pay was underestimated by 50 to 80%. Treat Claude’s output as a starting scaffold for junior and mid-level ranges, and validate anything senior against a dataset you trust before it goes in front of a candidate.


.png)